Is it possible to predict future price movement based on stock price history? While some might argue, there is some psychological effect you can take advantage of.
People, investors and traders, analytics and researchers, are looking for ways to predict future price movement of stocks, commodities, currencies, anything trading on global markets today. Some are keener to fundamental analysis, other too technical, while some are developing their own approach to step ahead of the market. The truth is there is no one best way to predicting stock market. In fact, the modern theory of stock market investing and trading is teaching you that it is not possible to predict the future, therefore money management and risk management strategies play the key role in your long-term success.
We agree to the theory that stock market future is mostly unpredictable, however we also believe that it is possible at least to determine some levels, where you can expect the stock price to move to and hold to it once reached. These levels are support and resistance levels as technical analysis is teaching you and can be determined by using several methods, like classic support resistance lines, trend channels, moving averages, Fibonacci retracements, and others. No matter which method you use, there is always a mass psychological effect behind, which truly determines future movement of stock price, and it is based on
stock price history.
Let us tell you a story that might sound familiar to you...
Typical Investor's Mind
John, a newbie to stock market investing is very passionate about finding new and easy way to earn money: trading stock. He starts reading some stuff on the web, does a little education, opens a broker account and starts filtering stocks to narrow down the buy candidates. Finally he found his favorite stock, symbol ABC. John doesn't yet have any trading experience, all he knows is that company is doing just fine and the stock price history on his line charts looks superb: the stock is only rising for the last 9 months. He puts the stock on his watch list and follows it every day.
As he is watching the stock, the uptrend is still holding for some time, so he decides to enter the position on the next consolidation. When it happens, he misses it, since he was not able to recognize all the correct signs. Hi is being inpatient and thinking that if he waits longer, he will miss the whole profit from the uptrend; so he decided to buy the stock on the New York Stock Exchange. Few days after he is happy with the decision he made, since the price of the stock continues to rise.
But unfortunately it didn't last long. Price of the ABC stock starts falling and as the price goes down, John is thinking about increasing his position. As soon as the price reaches few percent bellows his buying level he truly does double his position. But the problem is that the stock is continuing to lose its value. John is looking at the loss in his portfolio and he decides to sell as soon as the buying price is reached and he is leveled. But the stock doesn't seem to find the bottom. Once or twice on the way down John was sure to see the bottom, but he was wrong. Now he is changing his short-term trade into long-term investment.
But the free fall of the stock price history didn't end yet. John was becoming angry about all the stock market participants, especially SEC while not protecting the market. And when he saw the stock another five percent lower after few days, hi decided to exit the position. He had enough, he sold out and he decides to stay out of this stock for ever.
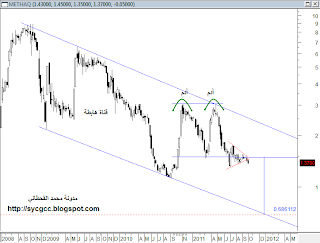
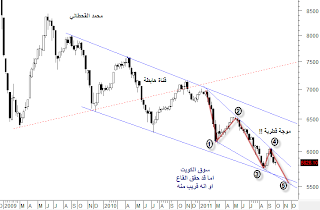
Oh god was he happy that he has sold ABC stock, because it didn't stop falling on his exit level. But shortly the stock stopped falling. John is thinking that it is temporarily only, it will tank again soon. And it really does, but only to perform the double bottom on the stock price history chart. Afterwards the trend changes again; stock started to gain from session to session. This is driving John crazy. He doesn't understand what the hell is going on. When the stock price was approaching his entrance level, John was becoming more and more confident. Hi knew all the time that this was going to happen. Only few percents bellow his first entrance level John decides to buy the stock again, because it was cheaper than the first time and it is a good company we are talking about.
Guess what, who sold him the stocks? Professionals did!
We would like to teach you from the story above, that it is investor's mind which is the biggest obstacle in trader's success. Because of investors' mind certain levels in stock price movement are established and can be very easily seen on the
stock price history chart as support and resistance levels. Pros enter positions at the beginning of a trend and exit just before the end, while beginners often do just the way around. It is in human nature to think only about profit before entering a stock position. But once you bought the stock and it doesn't go in the direction you would like it to, you only think about exiting the position as soon as you are leveled. Are you any different?
In this manner stock price history can help us being better trader or investor. It doesn't tell you whether the stock price will go up or down next day, but it does tell you where it will probably stop if it breaks current support or resistance levels. And this is the piece of information you can take advantage of.
Do you like the story? Share it, link to it, like it.


